The climate risk index 2026 is a simple yardstick that ranks countries by how severely extreme weather affected them in the most recent assessment year. It looks at human impact and economic losses to show which places felt the worst damage and where systems are most exposed. Policymakers, students and media use this index to understand patterns, compare countries and plan risk reduction.
The CRI is a comparative ranking built from a fixed set of indicators. It focuses on observed impacts of events like heatwaves, floods, storms and landslides rather than long-term climate policy. Lower rank numbers usually mean greater impact in that cycle.
Why the CRI matters for people, cities, and economies?
A clear rank helps show where lives and livelihoods are at most risk, where losses concentrate and which regions need early warning, infrastructure upgrades and finance. The climate risk index 2026 also helps track whether risks are rising or falling over time.
Who publishes it and how often it is updated
The CRI is compiled and released annually by a reputed international research group that analyses official disaster data and economic loss statistics. Each edition reviews a defined time window and then publishes country-wise scores and ranks.
| Item | Details |
|---|---|
| Publisher | Independent international research organisation (annual report) |
| Purpose | Show where extreme weather impacts were worst in the year reviewed |
| What it measures | Fatalities, fatalities per 100k, economic losses (US$), losses as % of GDP |
| How to read ranks/scores | Lower rank = higher impact in that year; scores combine multiple indicators |
Impacts of Climate Change on India
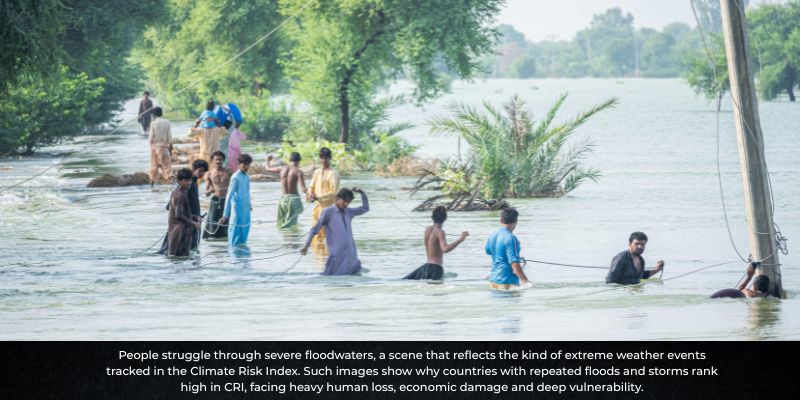
Climate change is reshaping India’s weather, water, and economy in visible ways. Hotter heatwaves are lasting longer and pushing up health risks and electricity demand, while erratic monsoons bring both intense downpours and dry spells that hurt crops, groundwater, and city drainage. Cyclones in the Bay of Bengal and Arabian Sea are showing stronger rainfall and wider impact zones, causing coastal flooding, erosion, and saltwater intrusion.
In the Himalayas, faster glacier melt and unstable slopes raise the risk of flash floods and landslides. Urban areas face heat-island effects and flooding from overwhelmed storm drains; rural regions see crop losses, pest outbreaks, and water stress that affect incomes and food security. These impacts ripple into public health, migration, infrastructure damage, insurance costs, and GDP growth, making early warning systems, heat action plans, flood-safe infrastructure, climate-smart agriculture, and resilient power and water systems essential for long-term stability.
India’s position in the climate risk index 2026 reflects the exposure of a large population, long coastline, dense cities and monsoon dependence. The report generally discusses heatwaves, urban flooding, cyclones, landslides and riverine floods.
India’s rank and what that rank means?
A lower rank (closer to 1) means higher impact in the assessed year. Interpretation combines absolute losses, per-capita losses and relative-to-GDP shocks. The report text helps explain why the rank changed.
Main hazards for India
-
Heatwaves affecting health, productivity and power demand
-
Cyclones & storm surges along the eastern and western coasts
-
Urban and riverine floods during heavy monsoon spells
-
Landslides in hill states during intense rainfall
Trend vs past five years (is risk rising or falling?)
The trend shows whether India’s adaptation measures (heat action plans, flood early warning, cyclone shelters) are reducing impact, or whether hazard intensity/exposure is still pushing risk upward.
India trend (CRI 2021–2026)
| Year | Key Events |
|---|---|
| 2021 | Cyclone/flood episodes, heat episodes |
| 2022 | Heatwaves, urban floods |
| 2023 | Monsoon extremes, landslides |
| 2024 | Cyclone on either coast, city floods |
| 2025 | Severe heat, flash floods |
| 2026 | Headline events of 2026 |
India: sector lens (2026)
| Sector | Typical Risk | Example 2026 Impact |
|---|---|---|
| Agriculture | Crop loss from heat/flood, irrigation stress | Yield dips during heat spells |
| Health | Heat stress, vector disease spikes | Higher heat-related ER cases |
| Infrastructure | Urban flooding, road/bridge damage | Traffic, freight delays |
| Power | Peak demand in heat, flood-hit substations | Local outages during peaks |
How the CRI is Calculated?
The climate risk index 2026 uses a transparent method: compile impacts from reliable global databases, compute per-capita and relative-to-GDP metrics, and then combine these into a single rank.
Indicators used
-
Fatalities (absolute)
-
Fatalities per 100,000 people
-
Economic losses in US$ (absolute)
-
Losses as % of GDP (relative impact)
Data sources and time window covered in the 2026 report
The report draws from global disaster datasets, national statistics and macroeconomic databases. The time window aligns with the latest complete calendar year for which verified data exists (the report explains the exact period).
Limits of the index
The CRI shows observed weather impacts, not future warming projections or overall climate policy quality. A single catastrophic event can elevate a country’s rank even if long-term risk is moderate. Likewise, a country with strong disaster management may show lower losses despite exposure.
CRI methodology in one page
| Indicator | Unit | Why it matters | Example |
|---|---|---|---|
| Fatalities | Number of deaths | Captures human toll of events | Deaths during floods |
| Deaths per 100k | Per 100,000 people | Reflects relative severity in smaller vs larger populations | Small island with few deaths can still rank high |
| Economic losses | US$ (constant) | Shows absolute damage to assets and output | Storm damage to roads and power lines |
| Losses as % of GDP | % of national GDP | Measures relative economic shock | Smaller economy with big hit can score high |
Building Resilience: What Works
Reducing risk requires early warning, better drainage and water management, stronger building standards, cool roofs, shelters, and risk finance that can quickly fund recovery.
Government and city actions
Upgrading flood maps, stormwater systems, reservoir operations and coastal embankments. City-level heat action plans with cooling centres and work-hour advisories reduce health impacts.
Community and school actions
Safe-shelter drills, first-aid training, water storage, rainwater harvesting and house-level retrofits. School awareness helps families act faster during warnings.
Finance and insurance
Risk pooling, parametric insurance, and resilient infrastructure funds speed relief and rebuild in high-risk districts identified by the climate risk index 2026.
| Risk | Low-cost fix (now) | Medium-term fix | Who leads | Co-benefits |
|---|---|---|---|---|
| Urban flood | Desilting drains, no-dump zones | Blue-green drainage, detention ponds | City govt + RWAs | Cleaner neighbourhoods |
| Heatwave | Shade, water points, work timing | Cool roofs, reflective streets | City govt + schools | Lower health burden |
| Cyclone | Sirens, shelters, last-mile alerts | Coastal embankments, resilient housing | State + disaster authority | Faster recovery |
| Landslide | Slope watch, drainage checks | Bio-engineering, retaining walls | Hill district admin | Safer roads |
Doon Defence Dreamers on Climate Risk Index
The Climate Risk Index 2026 helps explain which places faced the worst heatwaves, floods, cyclones and landslides in the last year. It also shows how transport, power, health services and farming can be disturbed when extreme weather hits. In the middle of this learning journey, Doon Defence Dreamers the best CDS Coaching in Dehradun, brings everything together with simple classes, map-based drills and case studies from Indian cities and coastal areas.
Cadets practise reading weather alerts, planning safe routes, setting up basic relief points and keeping water, first-aid and communication ready. Sessions highlight India’s recent experiences, the most at-risk sectors, and small fixes that work—like early warning systems, community shelters, heat action plans, rainwater drainage and quick repair funds. The goal is clear thinking, fast action and steady teamwork so that risks are reduced and normal life returns quickly after any severe event.
Frequently Asked Questions (FAQs)?
Q.1. What is the Climate Risk Index (CRI) 2026 and what does it show?
The Climate Risk Index 2026 is a comparative ranking that shows which countries were most affected by extreme weather in the latest assessment year. It looks at human impact (deaths, deaths per 100k people) and economic losses (absolute and as % of GDP). A lower rank number means the country suffered higher impact during that period, so it is more “climate-vulnerable” in that cycle.
Q.2. Who publishes the Climate Risk Index and how often is it updated?
The CRI is compiled and released every year by an independent international research organisation that analyses global disaster and economic loss data. Each edition uses a defined time window, usually the latest full calendar year with reliable statistics. The report then publishes country-wise scores and ranks so that policymakers, students and media can compare impacts across countries.
Q.3. How is the Climate Risk Index calculated and what indicators are used?
The Climate Risk Index is calculated using a fixed set of indicators drawn from global disaster databases and economic statistics. It combines four main indicators: total fatalities, fatalities per 100,000 people, total economic losses in US dollars, and losses as a percentage of national GDP. These absolute and relative indicators are merged into a composite score and rank that reflect both human suffering and economic shock.
Q.4. What are the main limitations of the Climate Risk Index as a measure of climate risk?
The CRI focuses only on observed impacts of extreme weather events like floods, storms, heatwaves and landslides in the past, not on future climate projections or strength of climate policies. A single catastrophic disaster can push a country’s rank higher even if its long-term risk is moderate. Similarly, a country with strong disaster management and early warning systems may show lower losses on the index despite high exposure to hazards.
Q.5. Why is the Climate Risk Index important for India and how can it guide action?
For India, the Climate Risk Index highlights how a large population, long coastline, dense cities and monsoon dependence create high exposure to heatwaves, cyclones, urban floods and landslides. The rank and trend over recent years show whether adaptation measures—such as heat action plans, cyclone shelters, flood early warning and better drainage—are actually reducing impacts. Governments, cities, communities and institutes like Doon Defence Dreamers can use these insights to plan infrastructure upgrades, risk finance, drills and awareness so that recovery is faster and losses are lower in future events.